All official European Union website addresses are in the europa.eu domain.
See all EU institutions and bodies
An official website of the European Union | How do you know?
Environmental information systems
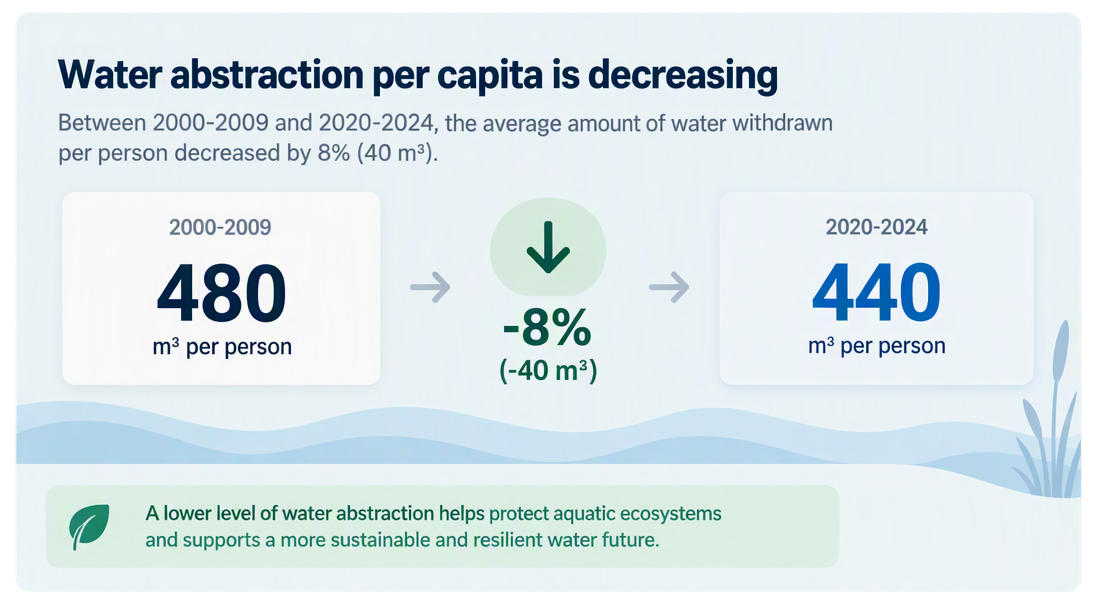
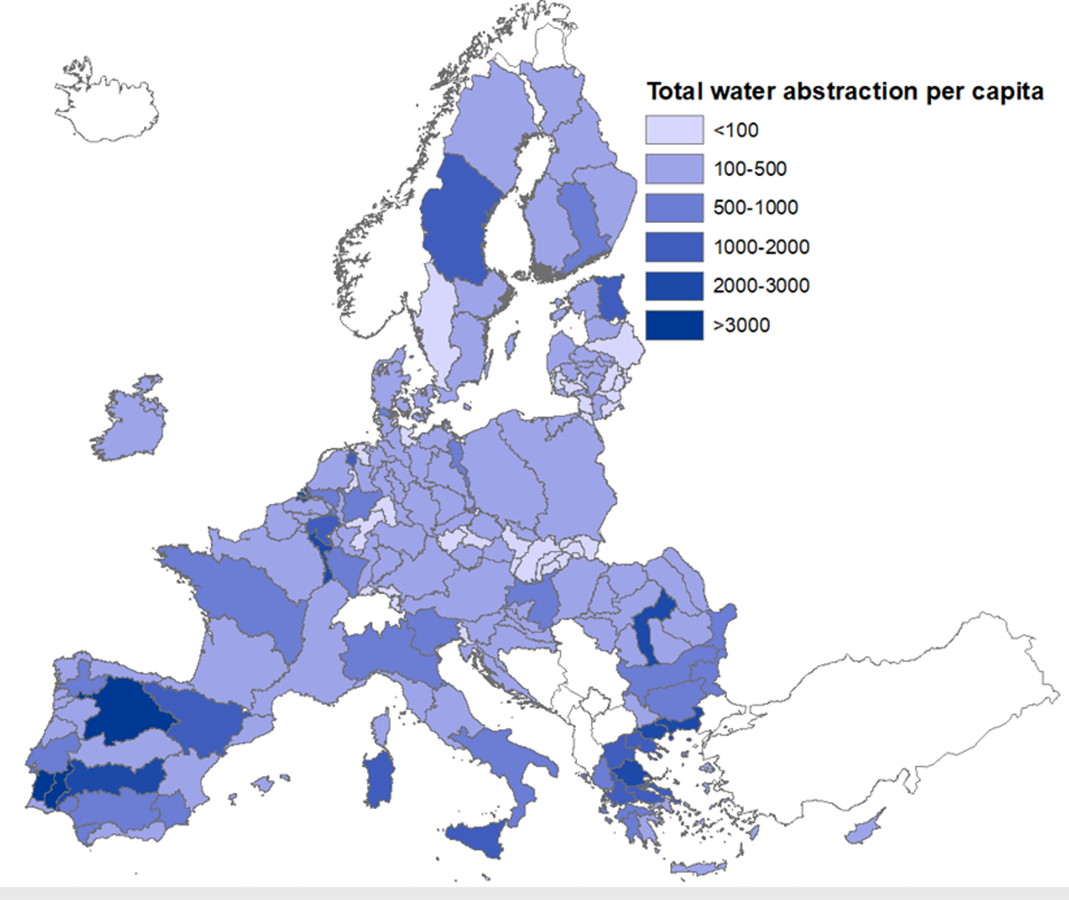
Total water abstraction per capita measures the average amount of water withdrawn from surface water such as rivers, lakes, reservoirs, and groundwater—per person within a given area and time.
Water abstraction per capita in EU
In 2023, the EU average of annual water abstraction for all economic sectors including the water abstraction for drinking water was 437 m3 per person.
Figure 5
Annual total water abstraction per capita in the EU, 2023
M3
Water abstraction by economic sector in Europe
In the EU-27, total water abstraction decreased by 14%, mainly due to reduced cooling water use in electricity production. Since 2010, total abstraction has been broadly stable, while sectoral patterns have shifted, with increases in public supply, agriculture, and industry.
Figure 6
Total water abstraction by economic sector, 2000-2023
Million m3
Water abstraction by source and economic sector in Europe
The Commission recommendation on guiding principles for water efficiency suggests that water savings are a key action for enhancing water resilience, and that priority should be given to sectors that consume the most water or have the highest potential for water savings.
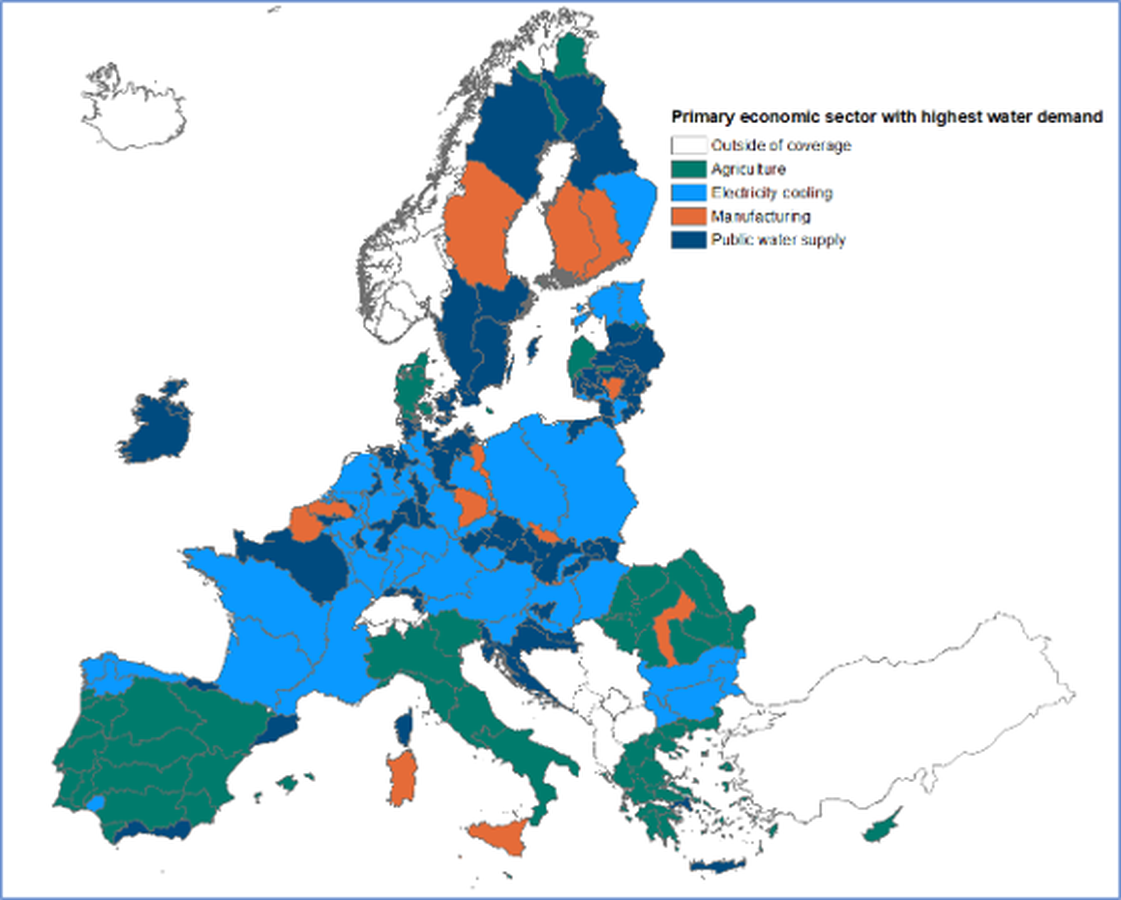
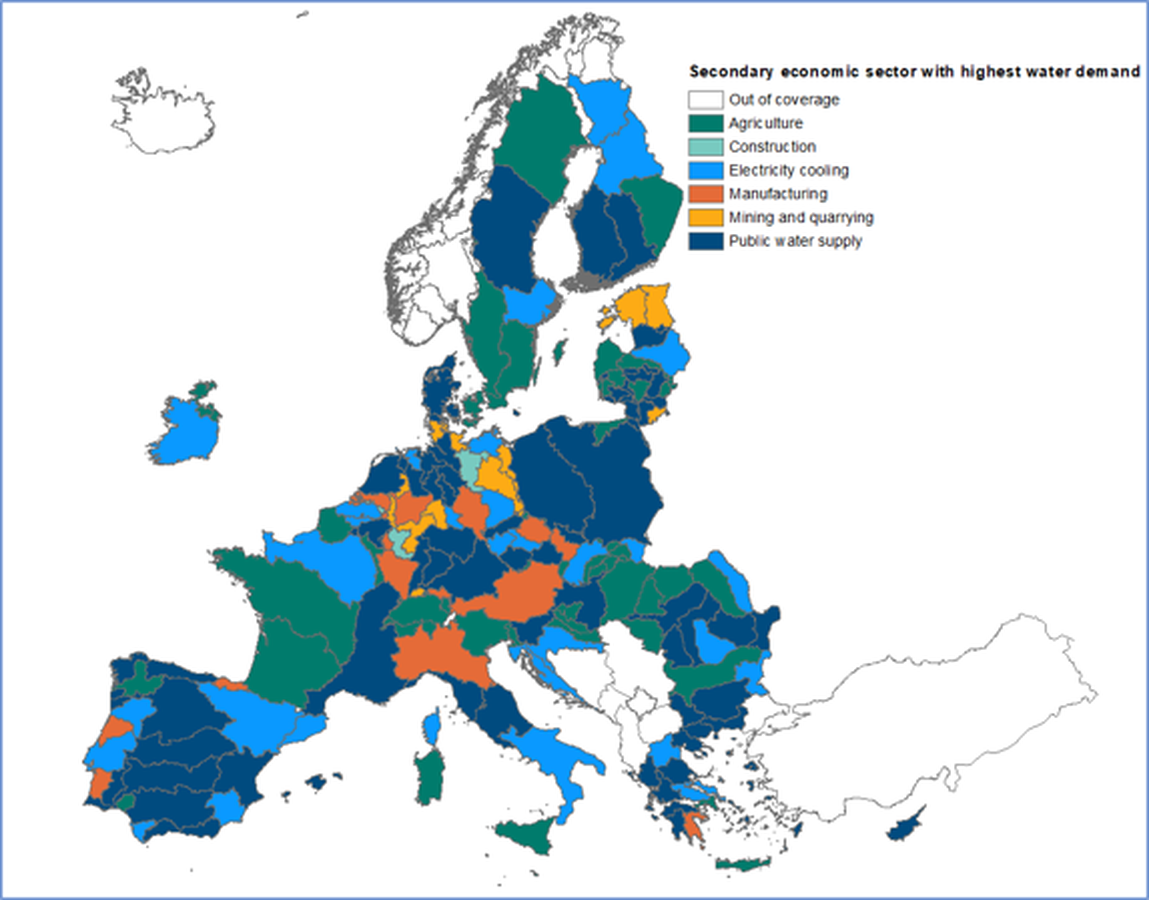
The potential for water savings varies greatly across EU river basins and across sectors. Economic sectors with the highest water demand in each river basin can achieve substantial savings by implementing technical and operational measures and by reducing losses and leakages.
Map view 6
Main economic sector with highest water demand, 2023
Unit of measure ?
Water use efficiency in economy
Economic sectors such as manufacturing, agriculture, and electricity production all rely on water in their production processes. The efficiency of water use in these sectors is commonly assessed by comparing water input with economic output.
Water input is generally measured as the cubic meters of water used by the economic sector, while economic output may be expressed in physical terms (such as kilograms or tonnes of product) or in economic terms (such as the net value added generated by the sector or by the total economy).
Read more
Water use efficiency in total economy of the EU-27
The EU used about 88 000 million m³ of water for all economic activities (excluding hydropower) in 2023. Total water use across the EU economy (excluding hydropower) has decreased by 19% since 2000, while the net value added from all sectors has increased by 30%.
Today, the EU uses 7.8 m³ of water to generate 1,000 PPS of net value added, down from 12.6 m³ in 2000.
Water use efficiency in manufacturing industry
Water use efficiency in agricultural sector
Water use intensity in the EU agriculture
Water abstraction for agricultural activities per hectare measures the volume of water withdrawn from all freshwater sources to support agricultural production, standardised by the total utilised agricultural area. This indicator provides insight into the intensity of water use in agriculture and helps assess the sector’s abstraction pressure on freshwater resources. Higher abstraction per hectare may reflect water‑intensive crops, inefficient irrigation practices, or increased water demand driven by climatic conditions, whereas lower values often indicate improved water‑use efficiency. Monitoring this indicator helps identify potential risks of water scarcity and supports the development of strategies to strengthen agricultural resilience.
Countries or river basins should be compared only within the same region, due to large differences in hydroclimate and market conditions across Europe.
Annual water abstraction for agricultural activities in the EU, 2023